Energy Management, IIT Mandi, Kamand Campus.
With growth and expansion of our institute , energy consumption has been increasing proportionally. The different types of energy consumption are Electrical Energy from the power grid, Solar Power for street lights, LPG for cooking, diesel for back-up generator and petrol and diesel for transportation.
More recently, DC electrical power based on Solar PV system has also been installed in a few of the institute buildings to cater for lighting and fan application. IIT Mandi is active in promoting research in the areas of energy, energy conservation and renewable energy system. However, very recently, DC power system application has been started in some of the buildings of the campus.
With a view to ensuring effective energy usage, we have initiated monitoring of the total electrical energy usage in the campus. Data collected for this purpose will be presented in this page. In future, the monitoring will be made even more effective by including weekly data, building wise daily, sector wise data and also data of energy from different sources, such as electric grid, renewable and back- up generators, per capita consumption of electricity data. It is hoped that this detailed monitoring will lead to careful energy planning and efficient usage of energy as the institute grows.Note: At present, our electricity charges are mainly based on the KVAH values and not in KWH, which is the actual consumption of electrical energy. Our Grid Electricity consumption is represented in the following graphs in KWH.
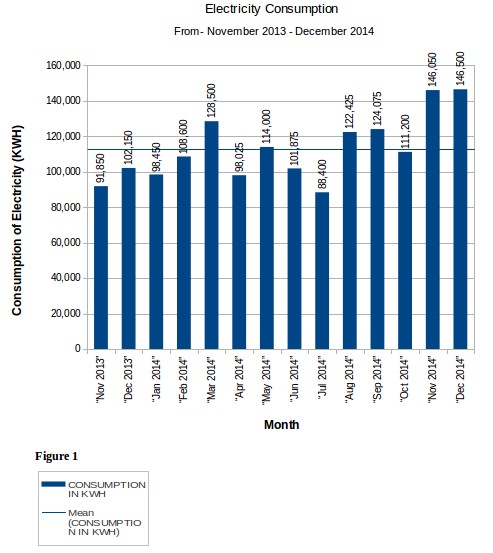
Fig:1 Electricity Consumption (November 2013 - December 2014)
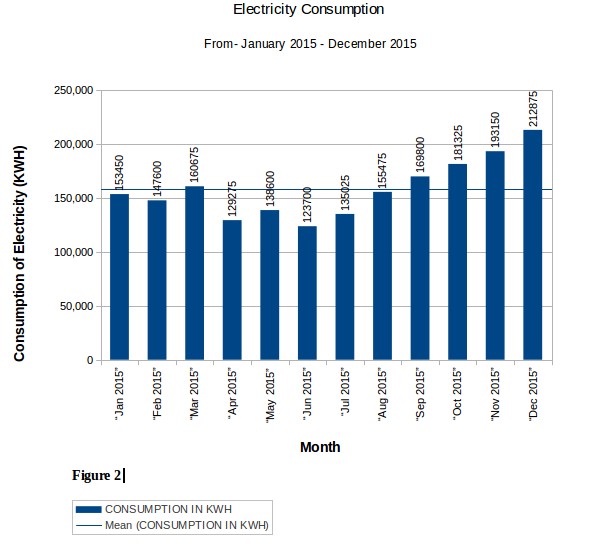
Fig:2 Electricity Consumption (January 2015 - December 2015)
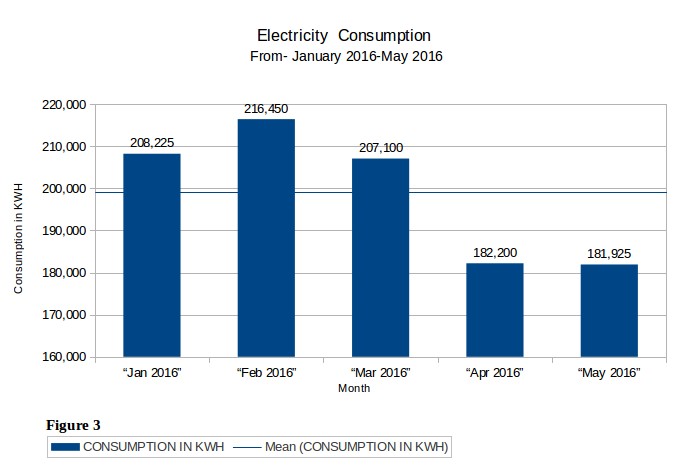
Fig:3 Electricity Consumption (January 2016-May 2016)
Discussion : The graphs (Figure 1 & 2) reveal almost similar seasonal variation in consumption of electricity at IIT Mandi, Kamand campus. The consumption of electrical energy is typically found to peak in the month of March. In April, it is lower than the mean. In the month of May, consumption is found to be more. A reduction of consumption was observed in June and July. In August, a little hike was observed ,which remained static in September. A higher peak was found to start from November and this condition was maintained in December. However, Figure 3 represents the consumption of electricity for the current year 2016 up till May only.
Thus, the year on year increasing energy usage pattern is reflecting energy consumption. More precisely, consumption of energy is correlated with increase in population of the campus. From November, 2013, data recording was started with a population strength of 55 - 60 people residing in Kamand campus. Gradually with the steady growth of the campus, consumption of energy started increasing exponentially. Thus, following energy consumption with population correlation, data of 2015 shows more consumption than that of 2014 , which in turn shows more consumption than the previous year.
In terms of energy consumption, it can be represented as 2016>2015>2014.
The probable reason behind the variation in consumption of electricity may be the following :-- Maximum usage of room-heaters in the months of winter (November onwards up till March)
- The month of May is the hottest month having fans on for maximum hours in the classes, offices and hostels
- A summer vacation in June lowers the usage of electricity
- In July, monsoon showers make the place pleasant and cool , reducing the use of fans and ACs
- The peak rises from November , reaches maximum in December because of winter months and more usage of heaters